According to the data of the the personal expenditure for “Recreation and Culture” in December 2022 represented 5.27% of the total household expenditure. This data shows a further decrease during the last decade, as in comparison to e.g.2017 when it represented 5.5%, while in 2014 it represented 6% of total household expenditure. In 2011, it represented 5.3%, in 2010 it was 5.6%, and it in 2009 it amounted to 5.99% (see sources in Compendium 2020 report, Primorac (2020)).
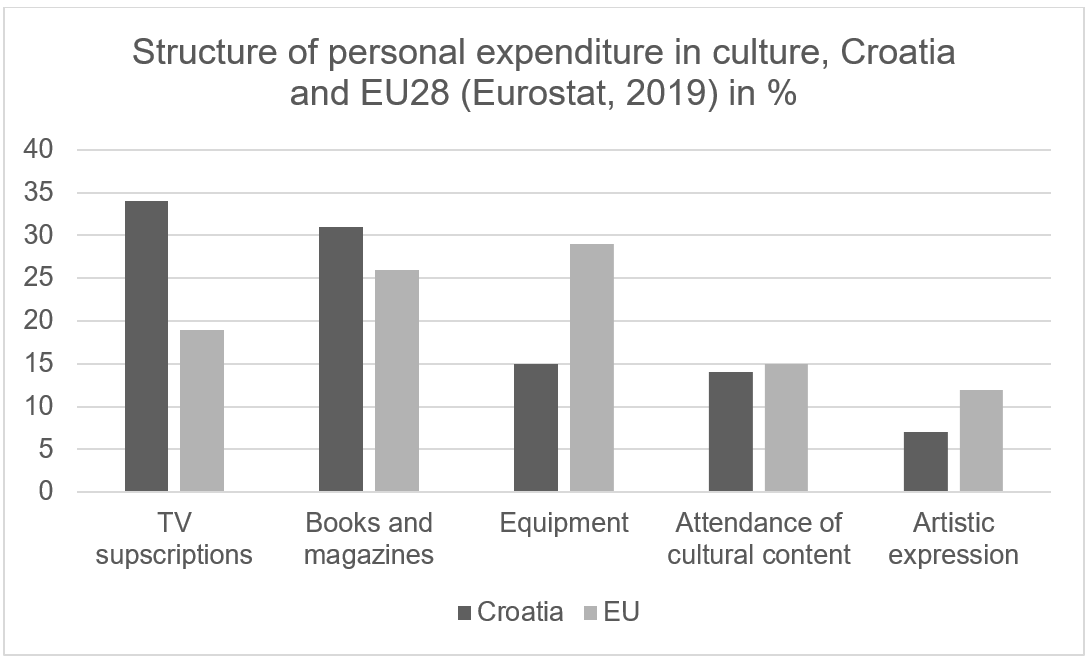
Data available by Eurostat (as presented in Tonković (2022)) shows the structure of the personal expenditure in culture of Croatia in comparison with the EU28 average as it can be seen from the Table 5. It shows similarities in the categories of personal expenditure in books and magazines and attendance of cultural content, but large disparities in the percentage of personal expenditure in TV subscriptions, equipment and artistic expression. In order to understand these disparities one should include the data on the purchasing power parities (PPP). According to Tonković (2022: 248), when one compares the data on cultural expenditure with the purchasing power standards, one can notice that Croatia belongs to countries with below average levels of expenditure and purchasing power, which makes it most similar to Slovakia and Poland, and below EU28 average in 2015, when the last comparative data by Eurostat was collected.

Table 5: Structure of personal expenditure in Culture, Croatia and EU28 comparison, data by Eurostat (2019) as presented in Tonković (2022: 249).
In continuation, we present the latest data available by Croatian Bureau of Statistics on the distribution of consumption expenditures for ‘recreation and culture’ in 2019 according to the detailed subcategories.
Table 6: Distribution of consumption expenditures, 2019, per 10 000
|
Expenditure group |
Imputed rent included |
Imputed rent excluded |
|
9. RECREATION AND CULTURE (TOTAL) |
426 |
532 |
|
9.1. Audio-visual, photographic and information processing equipment |
48 |
60 |
|
9.1.1. Equipment for receiving, recording and reproduction of sound and picture |
(23) |
(36) |
|
9.1.2. Photographic and cinematographic equipment and optical instruments |
– |
– |
|
9.1.3. Information processing equipment |
20 |
25 |
|
9.1.4. Recording media |
– |
– |
|
9.1.5. Repair of audio-visual, photographic and information processing equipment |
– |
– |
|
9.2. Other durables for recreation and culture |
– |
– |
|
9.3. Other recreational equipment, gardens and pets |
103 |
129 |
|
9.3.1. Games, toys, hobbies |
(14) |
(18) |
|
9.3.2. Equipment for sport, camping and open-air recreation |
(8) |
(10) |
|
9.3.3. Gardens, plants and flowers |
37 |
46 |
|
9.3.4. Pets, pet foods and related products |
33 |
42 |
|
9.3.5. Veterinary and other services |
(10) |
(13) |
|
9.4. Recreational and cultural services |
180 |
225 |
|
9.4.1. Recreational and sporting services |
(46) |
(57) |
|
9.4.2. Cultural services |
123 |
154 |
|
9.4.3. Games of chance |
(11) |
(14) |
|
9.5. Newspapers, books and stationery |
60 |
75 |
|
9.5.1. Books |
32 |
40 |
|
9.5.2. Newspapers and magazines |
16 |
19 |
|
9.5.3. Miscellaneous printed matter |
(0) |
(0) |
|
9.5.4. Stationery and drawing materials |
12 |
15 |
|
9.6. Package holidays |
(28) |
(35) |
Source: Croatian Bureau of Statistics (2021) Results of Households Budget Survey, 2019. Statistical Reports. Zagreb: Croatian Bureau of Statistics.

Comments are closed.